配置 Grafana Loki
本指南介绍了如何配置 Loki 以收集日志,以及如何配置 Grafana 以查询和显示 Milvus 集群的日志。
在本指南中,您将学习如何
作为参考,Promtail将被弃用。 因此我们引入 Alloy,它已被 Grafana Labs 正式推荐为收集 Kubernetes 日志并将其转发给 Loki 的新代理。
前提条件
- 在 K8s 上安装了 Milvus 集群。
- 已安装必要的工具,包括Helm和Kubectl。
部署洛基
Loki 是受 Prometheus 启发而开发的日志聚合系统。使用 Helm 部署 Loki,从 Milvus 集群收集日志。
1.添加 Grafana 的 Helm 图表存储库
将 Grafana 的图表存储库添加到 Helm 并更新:
helm repo add grafana https://grafana.github.io/helm-charts
helm repo update
2.为 Loki 配置对象存储
从以下存储选项中选择一个,并创建loki.yaml 配置文件:
-
选项 1:使用 MinIO 存储
loki:
  commonConfig:
    replication_factor: 1
  auth_enabled: false

minio:
enabled: true -
选项 2:使用 AWS S3 存储
在以下示例中,用自己的 S3 访问密钥和 ID 替换
<accessKey>和<keyId>,用 S3 端点替换s3.endpoint,用 S3 区域替换s3.region。loki:
commonConfig:
replication_factor: 1
auth_enabled: false
storage:
bucketNames:
chunks: loki-chunks
ruler: loki-ruler
admin: loki-admin
type: 's3'
s3:
endpoint: s3.us-west-2.amazonaws.com
region: us-west-2
secretAccessKey: <accessKey>
accessKeyId: <keyId>
3.安装 Loki
运行以下命令安装 Loki:
kubectl create ns loki
helm install --values loki.yaml loki grafana/loki -n loki
部署 Alloy
我们将向您展示 Alloy配置。
1.创建 Alloy 配置
我们将使用以下alloy.yaml 收集所有 Kubernetes pod 的日志,并通过 loki-gateway 发送给 Loki:
alloy:
  enableReporting: false
  resources: {}
  configMap:
    create: true
    content: |-
      loki.write "default" {
        endpoint {
          url = "http://loki-gateway/loki/api/v1/push"
        }
      }

      discovery.kubernetes "pod" {
        role = "pod"
      }

      loki.source.kubernetes "pod_logs" {
        targets    = discovery.relabel.pod_logs.output
        forward_to = [loki.write.default.receiver]
      }

      // Rewrite the label set to make log query easier
      discovery.relabel "pod_logs" {
        targets = discovery.kubernetes.pod.targets
        rule {
          source_labels = ["__meta_kubernetes_namespace"]
          action = "replace"
          target_label = "namespace"
        }

        // "pod" <- "__meta_kubernetes_pod_name"
        rule {
          source_labels = ["__meta_kubernetes_pod_name"]
          action = "replace"
          target_label = "pod"
        }

        // "container" <- "__meta_kubernetes_pod_container_name"
        rule {
          source_labels = ["__meta_kubernetes_pod_container_name"]
          action = "replace"
          target_label = "container"
        }

        // "app" <- "__meta_kubernetes_pod_label_app_kubernetes_io_name"
        rule {
          source_labels = ["__meta_kubernetes_pod_label_app_kubernetes_io_name"]
          action = "replace"
          target_label = "app"
        }

        // "job" <- "__meta_kubernetes_namespace", "__meta_kubernetes_pod_container_name"
        rule {
          source_labels = ["__meta_kubernetes_namespace", "__meta_kubernetes_pod_container_name"]
          action = "replace"
          target_label = "job"
          separator = "/"
          replacement = "$1"
        }

        // L"__path__" <- "__meta_kubernetes_pod_uid", "__meta_kubernetes_pod_container_name"
        rule {
          source_labels = ["__meta_kubernetes_pod_uid", "__meta_kubernetes_pod_container_name"]
          action = "replace"
          target_label = "__path__"
          separator = "/"
          replacement = "/var/log/pods/*$1/*.log"
        }

        // "container_runtime" <- "__meta_kubernetes_pod_container_id"
        rule {
          source_labels = ["__meta_kubernetes_pod_container_id"]
          action = "replace"
          target_label = "container_runtime"
          regex = "^(\\S+):\\/\\/.+$"
          replacement = "$1"
        }
      }
2.安装 Alloy
helm install --values alloy.yaml alloy grafana/alloy -n loki
使用 Grafana 查询日志
部署 Grafana 并将其配置为连接到 Loki 以查询日志。
1.部署 Grafana
使用以下命令安装 Grafana:
kubectl create ns monitoring
helm install my-grafana grafana/grafana --namespace monitoring
在访问 Grafana 之前,您需要获取admin 密码:
kubectl get secret --namespace monitoring my-grafana -o jsonpath="{.data.admin-password}" | base64 --decode ; echo
然后,将 Grafana 端口转发到本地计算机:
export POD_NAME=$(kubectl get pods --namespace monitoring -l "app.kubernetes.io/name=grafana,app.kubernetes.io/instance=my-grafana" -o jsonpath="{.items[0].metadata.name}")
kubectl --namespace monitoring port-forward $POD_NAME 3000
2.在 Grafana 中将 Loki 添加为数据源
Grafana 运行后,您需要将 Loki 添加为查询日志的数据源。
- 打开网络浏览器并导航至
127.0.0.1:3000。使用之前获得的用户名admin和密码登录。 - 在左侧菜单中选择连接>添加新连接。
- 在出现的页面中,选择Loki作为数据源类型。您可以在搜索栏中输入loki查找数据源。
- 在 Loki 数据源设置中,指定名称和URL,然后单击保存并测试。
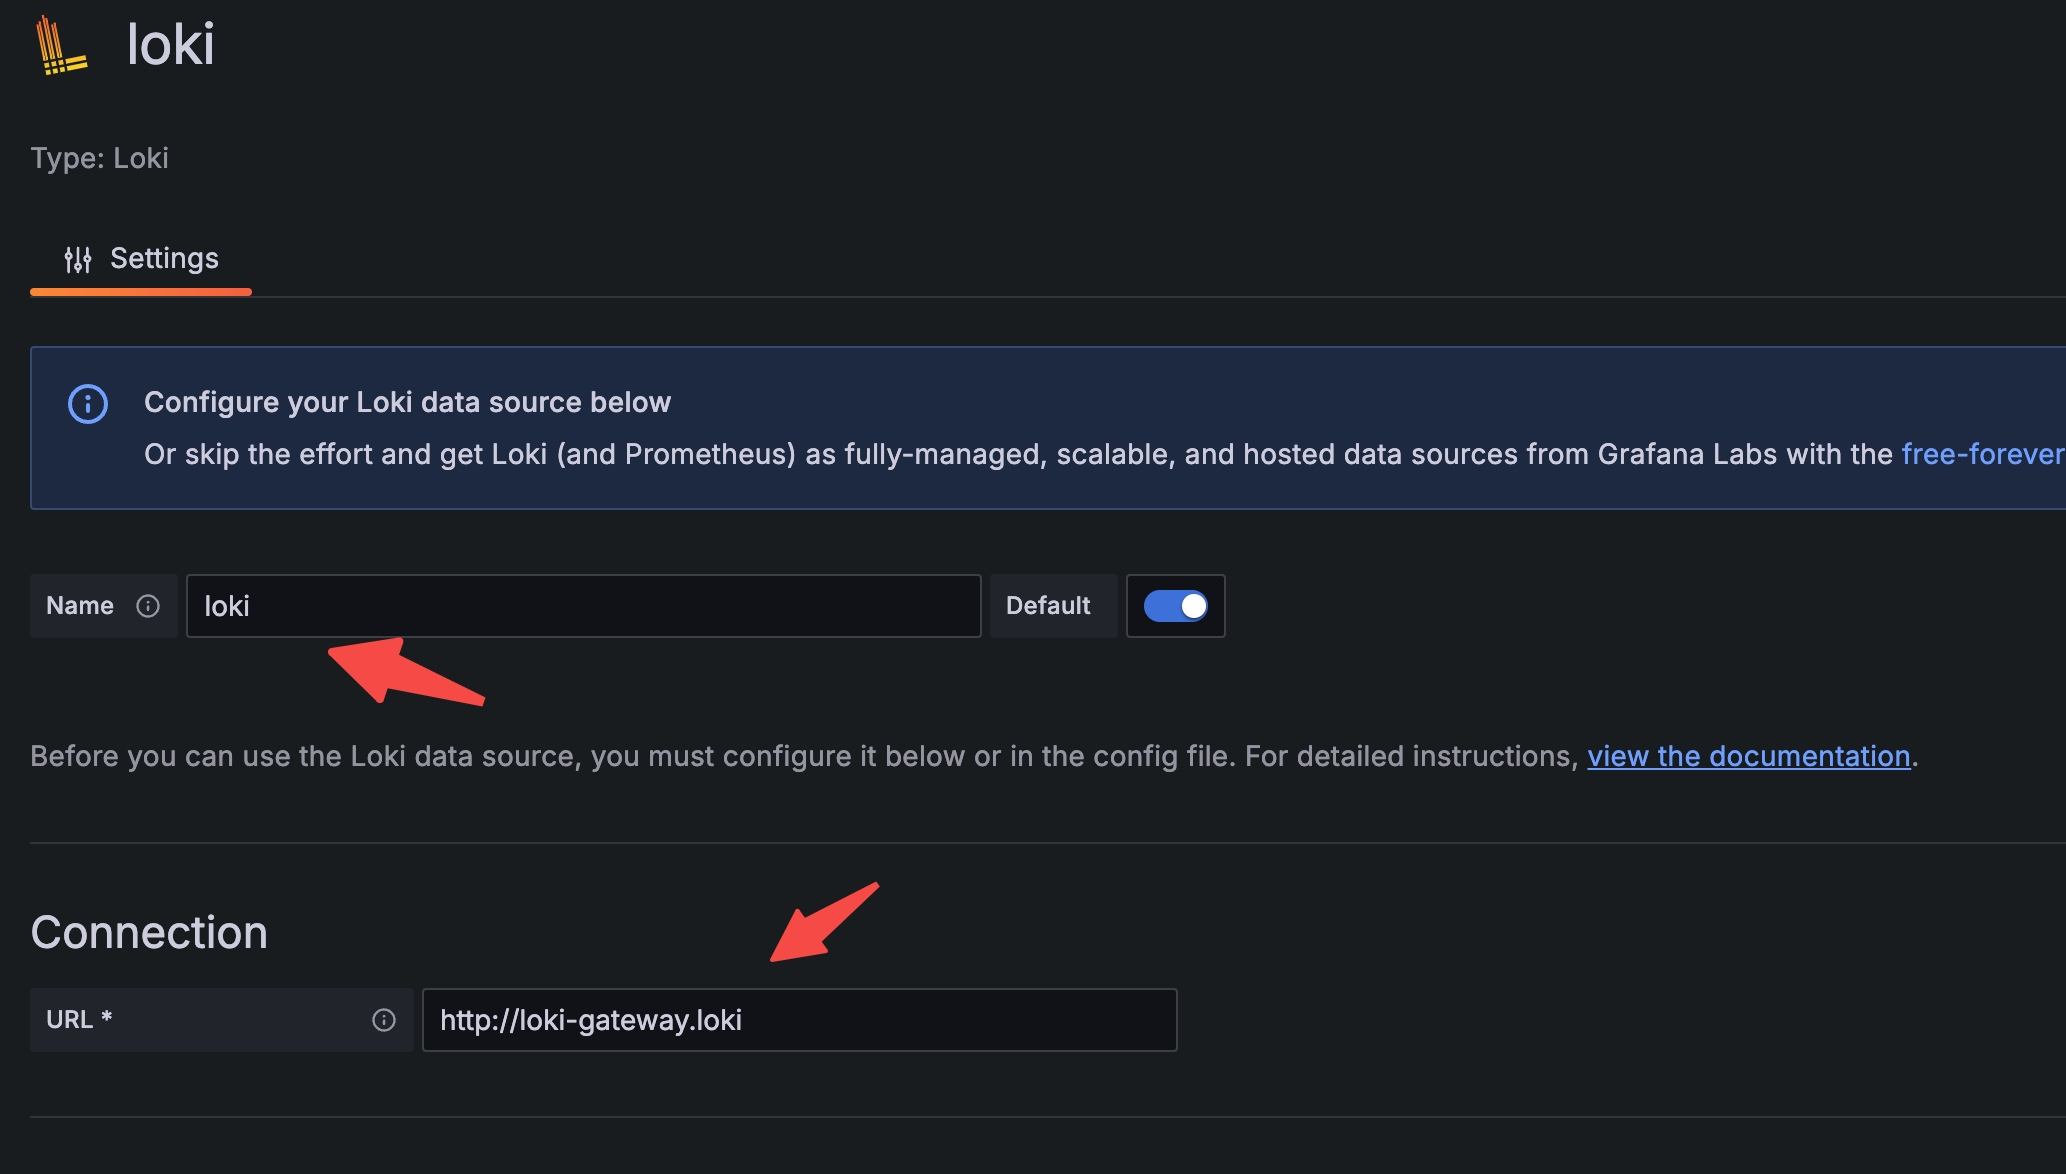 数据源
数据源
3.查询 Milvus 日志
将 Loki 添加为数据源后,在 Grafana 中查询 Milvus 日志:
- 在左侧菜单中单击 "探索"。
- 在页面左上角,选择 loki 数据源。
- 使用标签浏览器选择标签并查询日志。
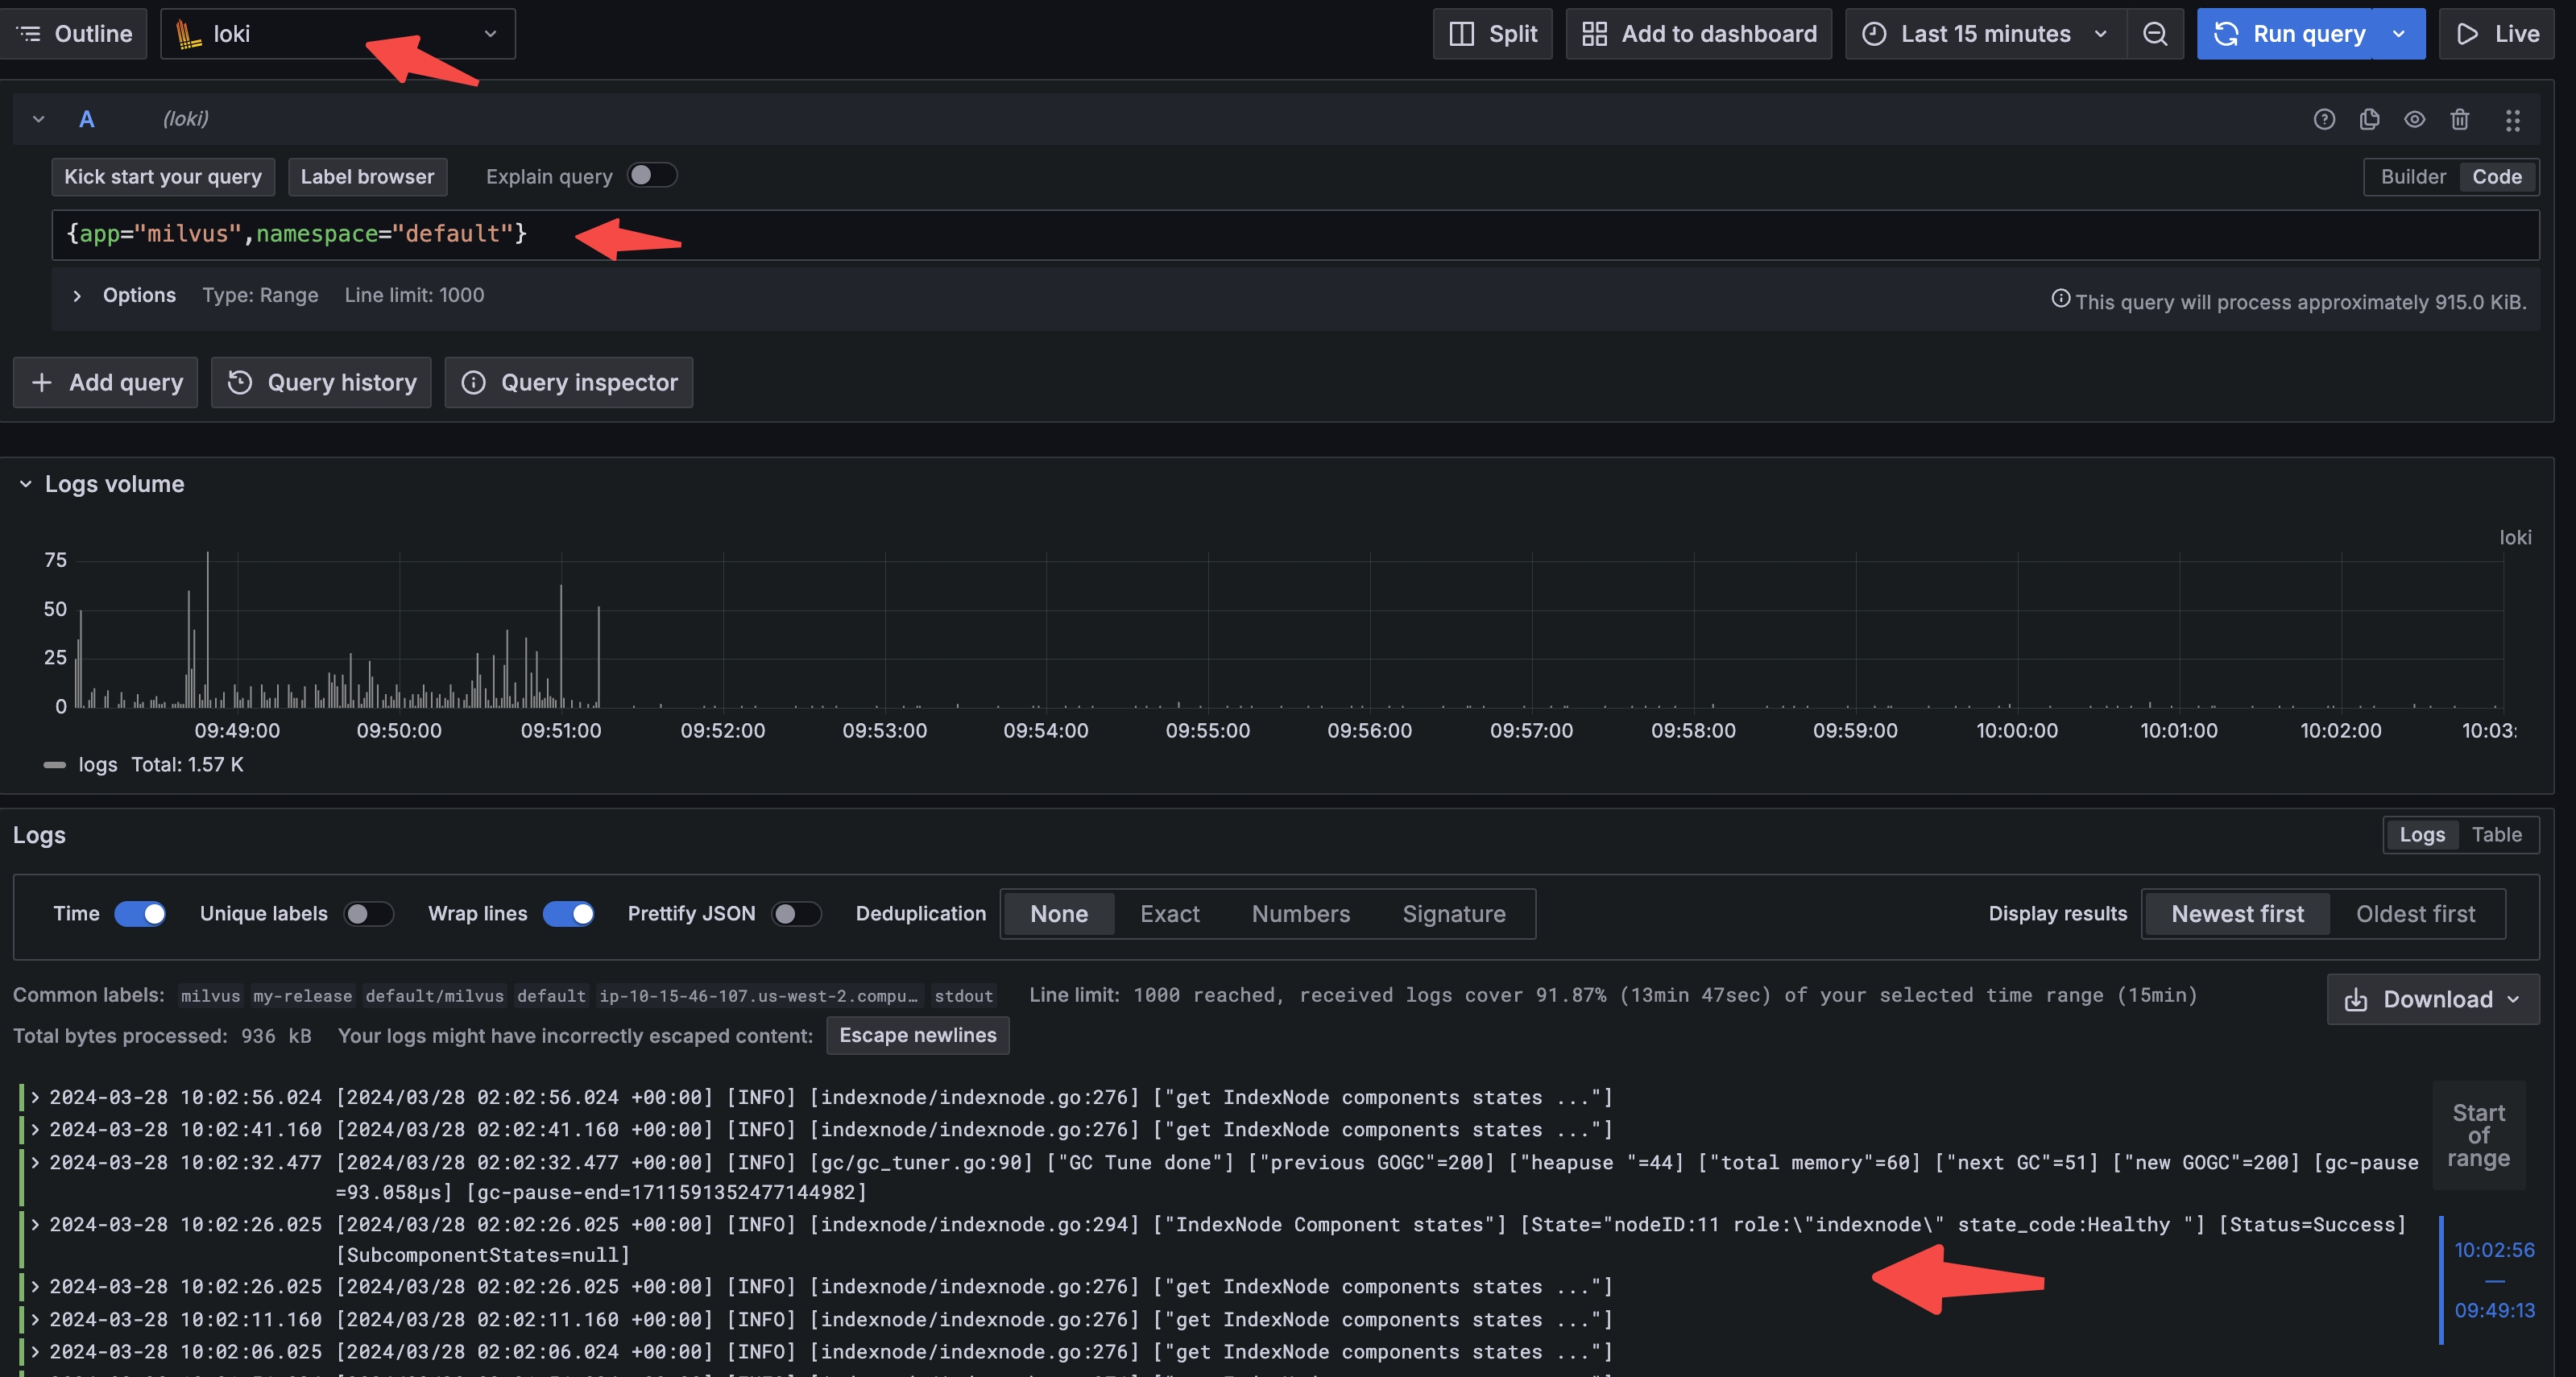 查询
查询